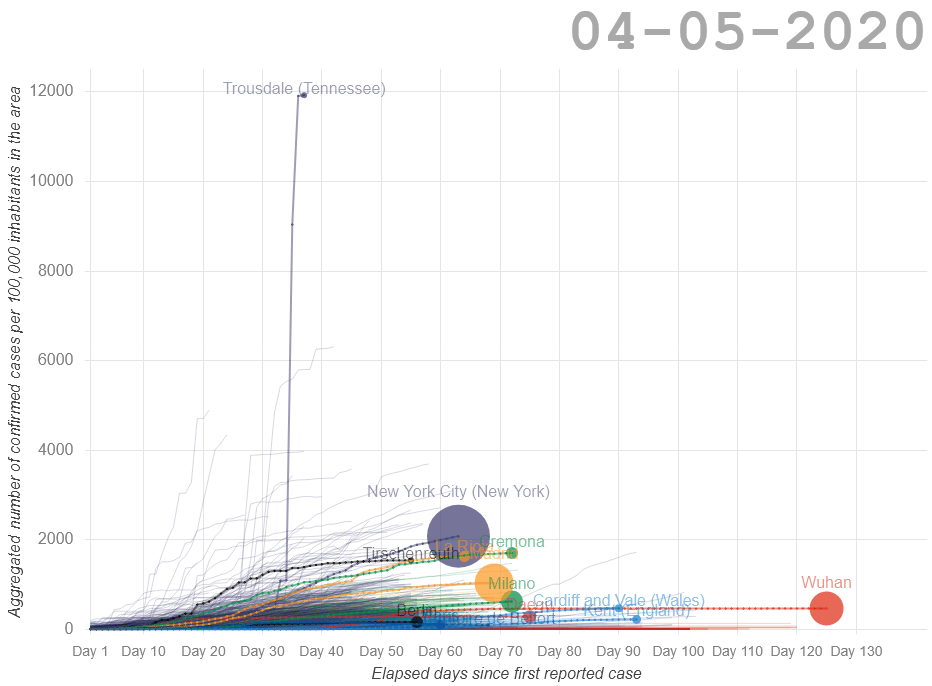
How Fast Is COVID-19 Spreading in Your Area?
Latest update: 04 May 2020
Design: @VizbyArcher © covid19viz.github.io
Covid19 Data Sources:
China: https://github.com/BlankerL/DXY-COVID-19-Data/
Korea: https://github.com/parksw3/COVID19-Korea
Italy: https://github.com/pcm-dpc/COVID-19
Spain: Datadista.com
Germany: https://github.com/swildermann/COVID-19
U.S.A.: JHU CSSE
France: https://github.com/opencovid19-fr/data
UK: https://github.com/tomwhite/covid-19-uk-data
Population and Other Sources:
CityPopulation.de
Wikipedia
Istat
U.S. Census Bureau
UK Office for National Statistics